Optimizing Kattis problems for fun and profit, part 1
After a too long break from my venture into competitive programming and dropping too far down on the global Kattis ranklist, I decided to solve a few problems focusing on constant factor optimization. Since low-level optimization is one of the to-be-written chapters in my sometime-to-be-completed book on competitive programming, I thought it would be a good opportunity to spend some time trying to find good Kattis problems to use as example. This will hopefully be a small series of posts, looking at a few problems until I stumble upon enough to write about all the techniques I want to include, and figure out how to put it together as a book chapter.
For this post, I picked the problem Reiknivel from the Icelandic high school olympiad, since it was the unsolved problem where the fastest accepted solution took the longest time.
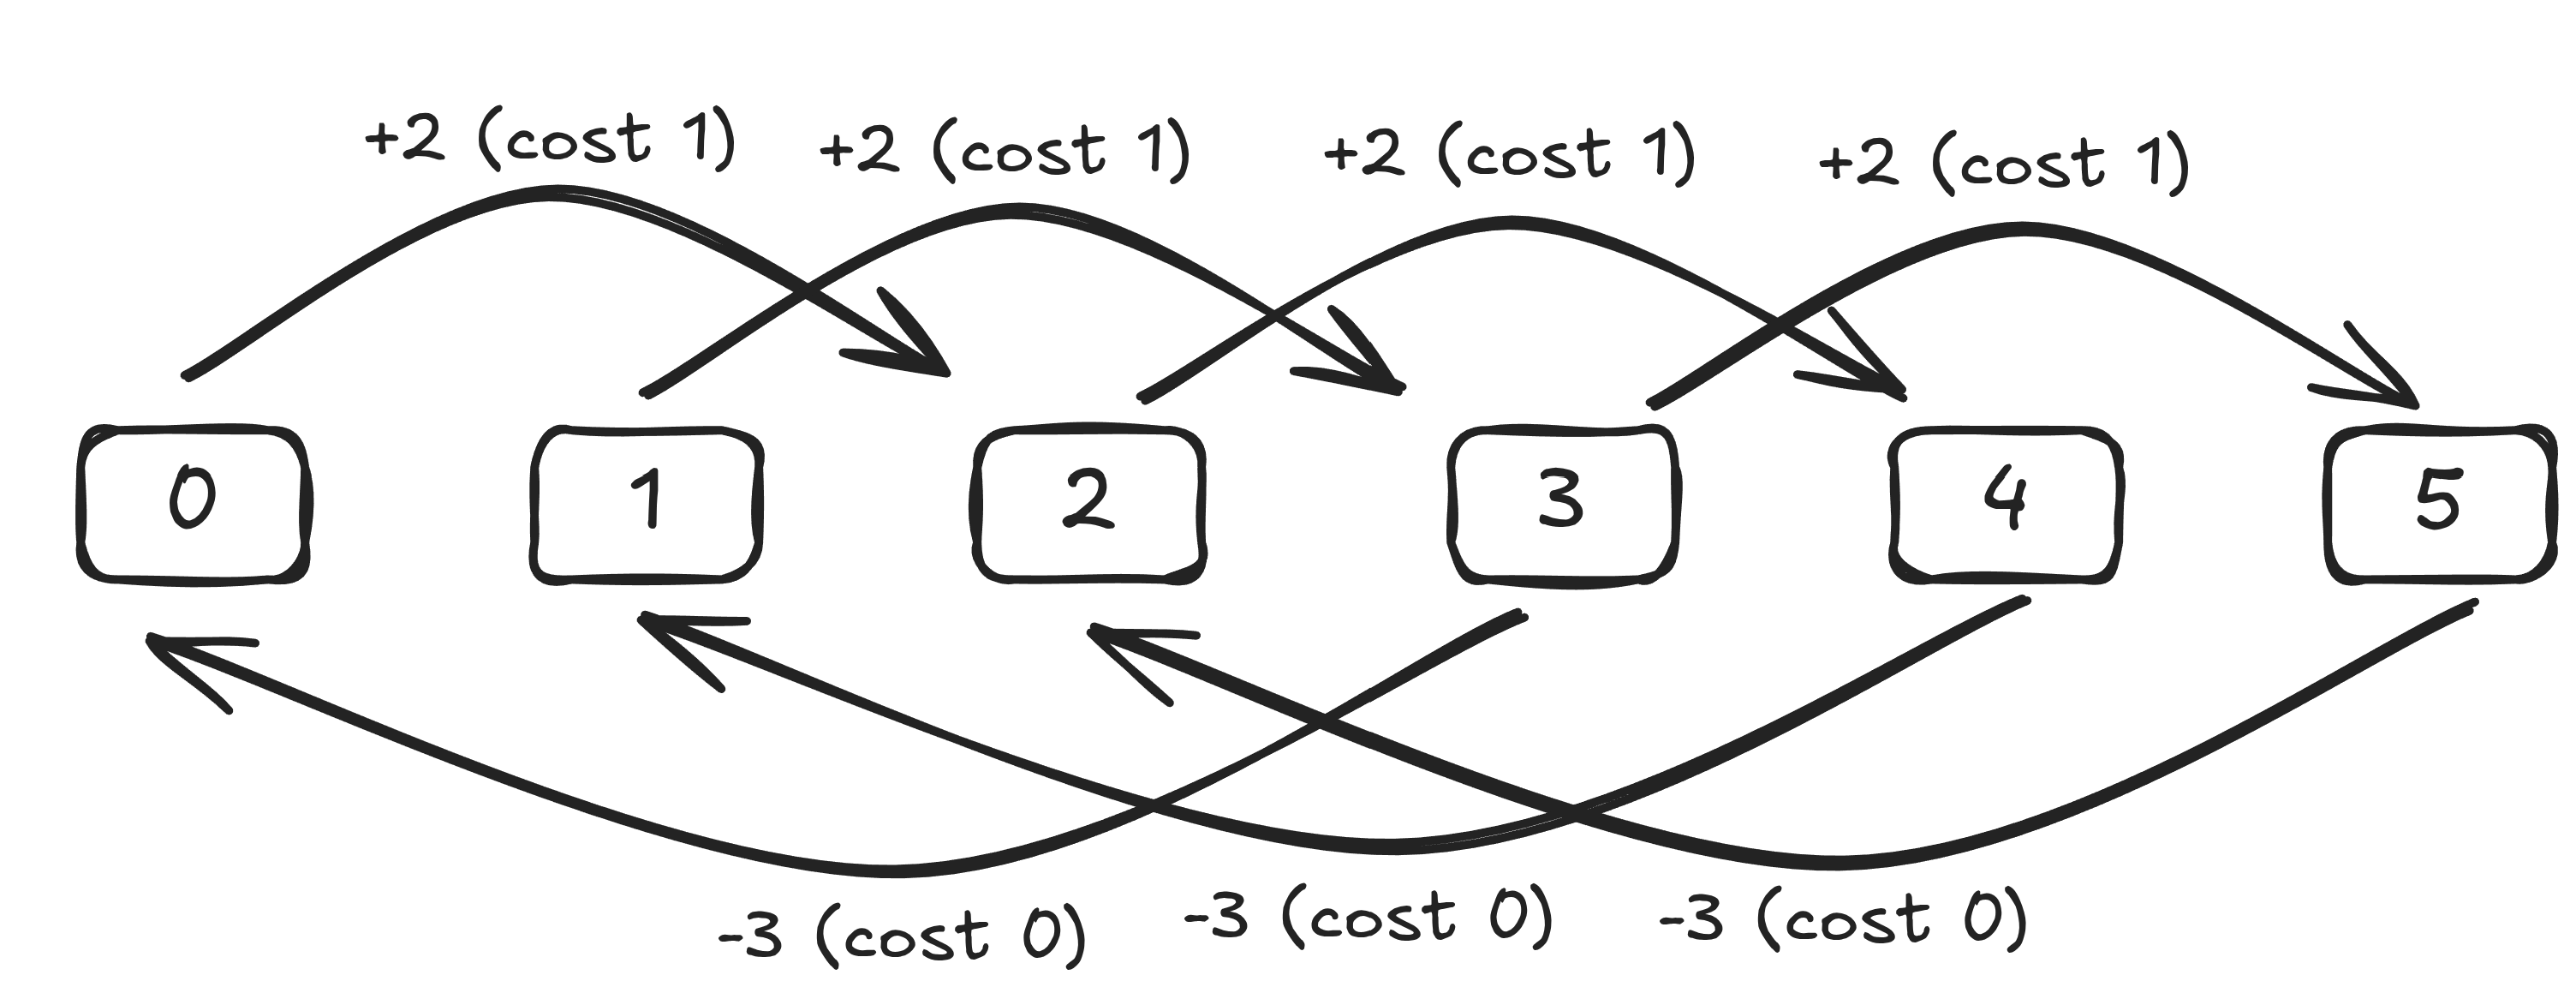
The problem can be summarized as follows. We start with the number 0, and repeatedly applying one of 5 operations, we want to reach a number $X$ ($0 \le X < 10^8$). The operations are of the form $num \leftarrow num \text{ OP}_i \text{ } v_i$, where $\text{OP}_i \in {\text{add}, \text{sub}, \text{mul}, \text{div}, \text{mod}}$ and $0 \le v_i \le 9$. Each operation has a given integer cost $0 \le c_i \le 3$, and the goal is to minimize the cost of reaching $X$.
Baseline solution
The problem can be modeled as a shortest path problem on a directed graph.
The most natural way to solve this problem is to use Dijkstra’s algorithm, which has a time complexity of $O(E \log V)$, where $E$ is the number of edges and $V$ is the number of vertices when implemented using a heap. This will serve as our baseline solution.
Before coding, let’s do the first performance measurement of all: napkin math of the time complexity. There are $10^8$ vertices, and $5$ edges per vertex. With a time complexity of $O(E \log V)$, we get $O(5 \cdot 10^8 \log 10^8)$. That’s $5 \cdot 10^8 \log_2 10^8 \approx 10^{10}$ The time limit is $8$ seconds, so with a processor of $3$ GHz, we have a budget of $\frac{8 \cdot 3 \cdot 10^9}{10^{10}} = 2.4$ cycles per edge. With some bad test data (this happens more than you think) and a very high degree of cache hits (this happens less than you want it to), we might get away with it.
#include <bits/stdc++.h>
using namespace std;

enum OpType { ADD, SUB, MUL, DIV };

struct Operation {
  OpType type;
  unsigned int value;
  unsigned int cost;
};

const size_t MAX_X = 99999999;

int main() {
  size_t A;
  unsigned int X;
  cin >> A >> X;

  vector<Operation> operations;
  for (size_t i = 0; i != A; ++i) {
    char op;
    unsigned int value, cost;
    cin >> op >> value >> cost;
    if (op == '+') {
      operations.push_back({ADD, value, cost});
    } else if (op == '-') {
      operations.push_back({SUB, value, cost});
    } else if (op == '*') {
      operations.push_back({MUL, value, cost});
    } else if (op == '/') {
      operations.push_back({DIV, value, cost});
    }
  }

  vector<unsigned int> distance(MAX_X + 1, numeric_limits<unsigned int>::max());
  using State = pair<unsigned int, unsigned int>; // (total cost, vertex)
  priority_queue<State, vector<State>, greater<State>> pq;

  distance[0] = 0;
  pq.push({0, 0});

  while (!pq.empty()) {
    auto [vertex_cost, vertex] = pq.top();
    pq.pop();

    if (vertex == X) {
      cout << vertex_cost << endl;
      return 0;
    }

    // We push the same vertex multiple times, so we need to check if we've
    // already visited it with a lower cost.
    if (vertex_cost > distance[vertex]) {
      continue;
    }

    for (const auto &op : operations) {
      unsigned int next_vertex = vertex;
      if (op.type == ADD) {
        next_vertex += op.value;
      } else if (op.type == SUB) {
        next_vertex -= op.value;
      } else if (op.type == MUL) {
        next_vertex *= op.value;
      } else if (op.type == DIV) {
        next_vertex /= op.value;
      }
      if (next_vertex > MAX_X) {
        continue;
      }
      unsigned int next_cost = vertex_cost + op.cost;
      if (next_cost < distance[next_vertex]) {
        distance[next_vertex] = next_cost;
        pq.push({next_cost, next_vertex});
      }
    }
  }

  cout << "Engin leid!" << endl;
}
I compiled the program with g++ -g -O2 baseline.cpp (the flags Kattis uses), and ran it on the three samples provided in the problem:
$ time ./baseline < tests/1.in
1

real    0m0,130s
user    0m0,021s
sys     0m0,109s
$ time ./baseline < tests/2.in
8

real    0m0,211s
user    0m0,093s
sys     0m0,119s
$ time ./baseline < tests/3.in
Engin leid!

real    0m4,091s
user    0m3,940s
sys     0m0,149s
4 seconds doesn’t seem to bad, the time limit of the problem on Kattis is 8 seconds. Let’s submit! …aaaand we immediately got time limit exceeded on the third sample case. That’s what you get for running a beefier CPU than the judging system’s, I guess.
This does immediately showcase one of the annoying parts about optimization in competitive programming; the hardware you run matters. Aside from the CPU frequency, your computer will differ from Kattis in cache sizes, memory latency, memory bandwidth, instruction extensions, and so on. The most serious and prestigious on-site competitions take this seriously: the judge executes submissions on hardware identical to the laptops provided to the contestants.
Asymptotic improvements
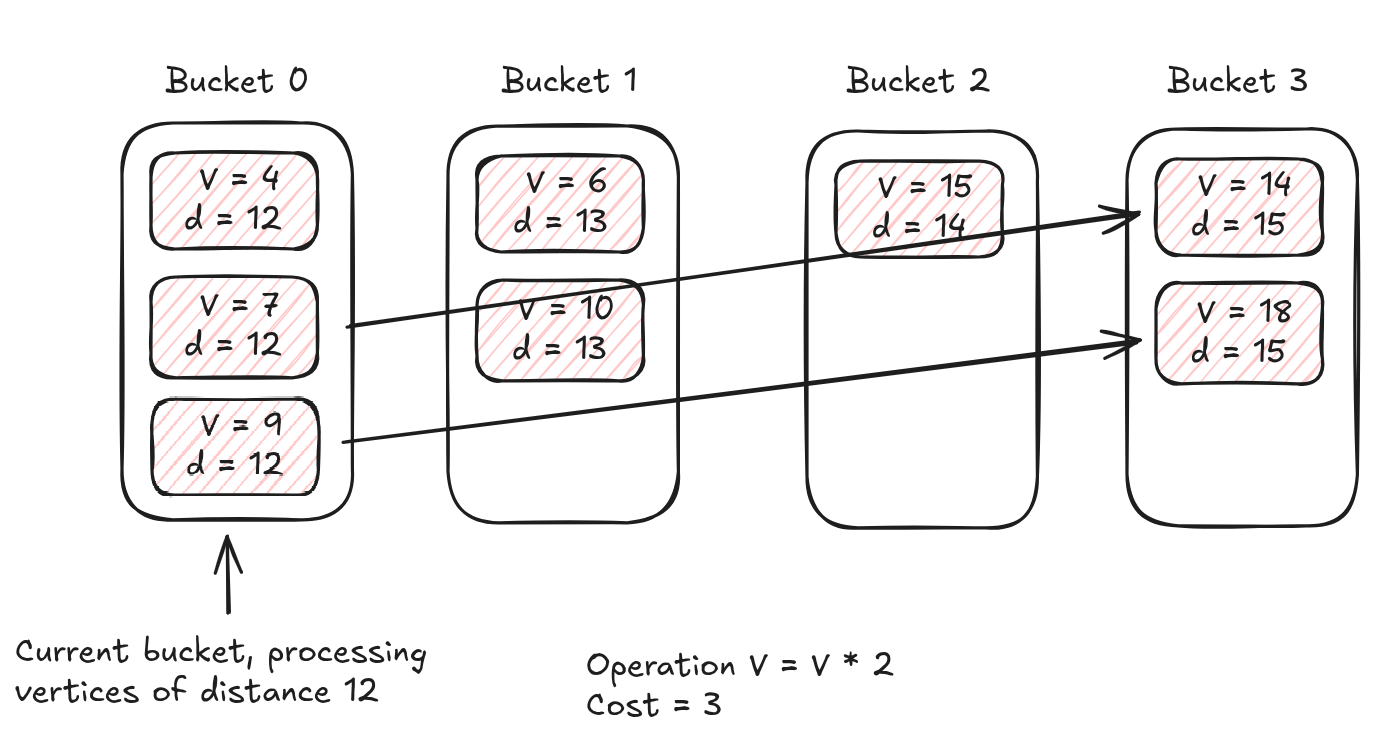
Before diving into optimization land, we have one asymptotic improvement we can make. Since the weights of our edges – i.e., the cost of the operations – are integers bounded by a constant $C$ (where $C = 3$ in our problem), we can use a trick that is commonly found in competitive programming to improve the asymptotic complexity of Dijkstra’s algorithm from $O(E \log V)$ to $O(E \cdot C)$. Instead of using a binary heap, we can use a bucket queue. Since Dijkstra’s algorithm will only in its active set keep vertices with distance at most $C$ greater than the distance of the current vertex, we can keep $C + 1$ buckets that we rotate among in a circular fashion, such that when we’re iterating through the active vertices of distance $d$ – kept in bucket $d \mod (C + 1)$ – and traverse an edge of weight $3$, we add it to bucket $(d + 3) \mod (C + 1)$. Hence, only $C + 1$ buckets ever need to be active at the same time, since when we’re processing vertices of distance $d$ in bucket $d \mod C$, we’ll add vertices at most distance $C$ away to bucket $(d + C) \mod (C + 1)$, so there are no collisions between vertices of different distances from the starting vertex.
We rewrite the Dijkstra loop accordingly:
 constexpr size_t Q = 4;

  vector<queue<unsigned int>> queues(Q);
  queues[0].push(0);

  bool all_empty = false;
  while (!all_empty) {
    all_empty = true;
    for (size_t i = 0; i < Q; ++i) {
      queue<unsigned int> &q = queues[i];
      if (!q.empty()) {
        all_empty = false;
      }

      while (!q.empty()) {
        auto vertex = q.front();
        q.pop();

        auto vertex_cost = distance[vertex];

        if (vertex == X) {
          cout << vertex_cost << endl;
          return 0;
        }

        if (vertex_cost > distance[vertex]) {
          continue;
        }

        for (const auto &op : operations) {
          unsigned int next_vertex = vertex;
          if (op.type == ADD) {
            next_vertex += op.value;
          } else if (op.type == SUB) {
            next_vertex -= op.value;
          } else if (op.type == MUL) {
            next_vertex *= op.value;
          } else if (op.type == DIV) {
            next_vertex /= op.value;
          }
          if (next_vertex > MAX_X) {
            continue;
          }
          unsigned int next_cost = vertex_cost + op.cost;
          if (next_cost < distance[next_vertex]) {
            distance[next_vertex] = next_cost;
            queues[(i + op.cost) % Q].push(next_vertex);
          }
        }
      }
    }
  }
and hope that it’s faster. I’ve eliminated a whole log factor ($\approx 26$) from the time complexity, so we should see a major speedup.
Engin leid!

real    0m1,368s
user    0m1,236s
sys     0m0,132s
About a 3x speedup, far from the 26x speedup from the asymptotic analysis. Pushing a vertex to the binary heap is not everything we do in the loop; the cost is more like $E \cdot (\log V \cdot \text{ time per push} + \text{the rest of the loop})$. Time complexity is not real-world performance! It’s always hiding constant factors in each term, and sometimes they can be a lot more unbalanced than you’d expect.
Time to submit to Kattis again. I’ve written a pretty standard solution to a problem where additional algorithmic improvements seems out-of-scope for a national olympiad, so this time we should be confident in it passing.
This time the solution passed, clocking in at 4.24 seconds and a 3rd place finish (out of 8 solvers). Of course, we’re here to optimize ourselves to a first place, which is only some 0.5s away at 3.76 seconds at the time of writing.
Enter perf
Harder than optimizing is finding out what we should optimize. Looking at our code, it’s not immediately obvious we have any room for improvements. The code is solid, and the most important part - the hot loop iterating through edges - is small and tight.
Optimizing C++ programs is a science. There are so many different things on today’s complex hardware that can be your bottleneck, but fortunately there are also plenty of tools to help us understand what’s going on. On Linux, perf is a easy to use tool to help profile your program.
To get a basic overview of what’s happening, I run perf stat -a -e cycles,instructions,stalled-cycles-frontend,branches,branch-misses,l3_lookup_state.l3_hit,l3_lookup_state.l3_miss ./queue < tests/3.in to get breakdown of some hardware counters related to performance. The specific command will depend on your hardware, on my Intel CPU I get the same data just with perf stat -d ./queue.
    10 805 658 502      cycles                                                                  (71,36%)
     7 463 440 764      instructions                     #    0,69  insn per cycle
                                                  #    0,36  stalled cycles per insn     (71,37%)
     2 695 384 657      stalled-cycles-frontend          #   24,94% frontend cycles idle        (71,42%)
     1 826 945 959      branches                                                                (71,49%)
        46 578 256      branch-misses                    #    2,55% of all branches             (71,51%)
       182 773 464      l3_lookup_state.all_coherent_accesses_to_l3
        78 720 513      l3_lookup_state.l3_hit
       104 053 170      l3_lookup_state.l3_miss
        72 419 614      dTLB-loads                                                              (71,46%)
        58 065 283      dTLB-load-misses                 #   80,18% of all dTLB cache accesses  (71,39%)

       1,389497446 seconds time elapsed
This result tells us that we have major memory-related problems. We miss over half of our L3 cache (the cache layer furthest from the CPU, right before hitting main memory) lookups, which is a sign of a bad memory access pattern. This is not surprising: Dijkstra’s algorithm iterates through vertex in essentially random order, and our hot loop iterates through a next_vertex that can be far away from the one we’re currently processing when we’re doing a MUL or DIV operation.
We’ll pull a trick out of our magic hat and help help the memory access pattern by sorting the vertices in the queue by number. This might be counterintuitive, but it makes sense: we could pay a whooping 2.6 billion currently idle cycles for removing every single memory access, and we’d not lose a second of runtime!
We make the corresponding changes:
...
  vector<vector<unsigned int>> queues(Q);
  queues[0].push_back(0);
  ...
  distance[0] = 0;
  ...
      vector<unsigned int> &q = queues[i];
      ...
      sort(q.rbegin(), q.rend());
      ...
        auto vertex = q.back();
        q.pop_back();
        ...
            queues[(i + op.cost) % Q].push_back(next_vertex);
...
Before processing all the vertices of a certain distance, we sort them in reverse order according to some vague intuition that it will help the memory access pattern (that we’ll “typically” iterate through vertices in ascending order, and want to keep that order). This helps a bit, reducing our L3 misses from 104M to 81M, not too dissimilar to our decrease in runtime:
 Performance counter stats for 'system wide':

     8 321 138 554      cycles                                                                  (71,43%)
     8 437 471 369      instructions                     #    1,01  insn per cycle
        81 817 765      l3_lookup_state.l3_miss

       1,169339340 seconds time elapsed
Note that the number of instructions executed exceeds the number of cycles. Modern CPUs are superscalar, meaning they can execute multiple instructions per cycle by working on multiple instructions at the same time if possible. For example, my processor caps out at about 4 IPC (instructions per cycle) when performing simple ALU operations (which makes sense, since it has 4 ALUs).
Another improvement, another Kattis submission. 6.08s! Wait, it’s slower??
Optimize for your workload, don’t create your workloads for the optimization
So, we’ve just made our program faster, except Kattis didn’t agree with it. It’s not entirely surprising. We’ve only optimized our program and measure it on a single test case. The Kattis problem has 128 test cases, each of which could trigger completely different bottlenecks or memory access patterns.
Instead, I’ll use the following test case:
5 93845951
* 9 3
* 8 2
+ 1 1
/ 9 3
/ 8 2
It’s constructed such that all vertices are reachable, the vertex we’re looking for is among those furthest away, and the operations are chosen such that the memory access pattern is as bad as possible for our solution – very far away, and in both forward and backward direction. The new workload is much worse for our solutions. In competitions you don’t know what test cases you’ll get, so you should try to optimize for your worst case.
The first improvement (queue) gives:
    31 636 736 151      cycles                                                                  (71,40%)
    18 465 556 406      instructions                     #    0,58  insn per cycle
                                                         #    0,31  stalled cycles per insn     (71,42%)
       338 636 481      l3_lookup_state.l3_miss
       308 286 163      l3_lookup_state.l3_miss
       4,209182113 seconds time elapsed
while the version with sorting gives:
    25 956 099 361      cycles                                                                  (71,43%)
    45 530 009 525      instructions                     #    1,75  insn per cycle
                                                         #    0,14  stalled cycles per insn     (71,43%)
       190 312 341      l3_lookup_state.l3_miss
       3,738281835 seconds time elapsed
This shrunk the relative speedup even further, but more importantly it showed that our sorting program is now perhaps not even memory bound: 1.75 IPC is not terrible, and we’re barely stalled at all. We’re still quite clearly faster than the old verison though, perhaps the testdata on Kattis doesn’t have any test cases that trigger worst-case memory access patterns? In that case, spending all those cycles sorting would just be a waste of time.
To cheat help Kattis strengthen the testdata, I downloaded the official test data and ran my solutions on it. On the official testdata, the sorting version is slightly faster:
   AC submission queue.cpp (C++) OK: AC (100) [testcase: testcase secret/GD/3, CPU: 2.72s @ testcase secret/GD/046-GD-04]
   AC submission sort.cpp (C++) OK: AC (100) [testcase: testcase secret/GD/3, CPU: 2.69s @ testcase secret/GC/029-GC-02]
but in particular, the test data clearly lacked worst-case memory access patterns, since they are significantly slower on my case.
Such is the life when optimizing for CPUs and memory configurations that you don’t have access to. Since we’re going for top 1 on Kattis, we’ll give up on the sorting idea and look for other avenues.
Work smarter, not harder
Having abandoned paying cycles to improve access patterns, we need to find other ways to improve memory performance. Another common avenue is to help it speed memory accesses up by keeping its working set, i.e. the amount of memory it simultaneously is working with, small. A smaller working set means a larger part of it fits into the CPU caches, and cache accesses are much faster than main memory accesses. See this rule of thumb for a decent approximation.
Sometimes, for memory latency bound programs, you can pay cycles to keep your working set small. For example, we implemented our first Dijkstra using a binary heap where we could, at times, have multiple copies of a vertex in the heap, in case we repeatedly found a shorter path to it. If $E = O(V^2)$, we might be paying $O(E)$ space for the heap, instead of $O(V)$ if we made sure to keep only a single copy of each vertex. Implementing your own heap supporting the decrease-key operation, or even using a std::set can bring drastic improvements to performance if it avoids trashing the cache!
Let’s become slightly more serious performance engineers and measure the working set of our program. The biggest part of our random accesses come from the distance array, containing $10^8$ integers, each of 4 bytes. In total, that’s 400MB of memory. My CPU has 64MB of L3 cache, so we’re well above that; we’d expect completely random accesses to fall into the L3 cache about 16% of the time. If we managed to cut our working set down by 4x to 100MB, we’d instead hit the L3 cache about 64% of the time, reducing the L3 misses by ~2.3x.
In our case, we can reduce the 4-byte int required to store the distance to a 1-byte char, since we actually only need to be able to distinguish between
- having already finished processing the vertex,
- never having seen the vertex, or
- which of the 4 queues the vertex is currently in.
We’ll do it in the following way, replacing the distance array with a status array and keeping track of the distance of the vertices in the current queue separately:
#define UNSEEN 0xFF
#define FINISHED 0xFE
#define QUEUE(x) (x)
  vector<uint8_t> status(MAX_X + 1, UNSEEN);
  status[0] = QUEUE(0);

  unsigned int current_cost = 0;
  ...
    for (size_t i = 0; i < Q; ++i, ++current_cost) {
        ...
        auto current_status = status[vertex];
        if (current_status == FINISHED) {
          continue;
        }
        status[vertex] = FINISHED;
        ...

          auto next_status = status[next_vertex];
          if (next_status == FINISHED) {
            continue;
          }
          auto next_queue_current =
              (next_status < i ? next_status + Q : next_status);
          auto next_queue_new = i + op.cost;
          if (next_queue_new < next_queue_current) {
            status[next_vertex] = QUEUE(next_queue_new % Q);
            queues[next_queue_new % Q].push(next_vertex);
          }
          ...
    }
This new solution is also faster:
    27 808 932 796      cycles                                                                  (71,40%)
    20 199 144 815      instructions                     #    0,73  insn per cycle
                                                  #    0,28  stalled cycles per insn     (71,42%)
     5 694 158 124      stalled-cycles-frontend          #   20,48% frontend cycles idle        (71,44%)
     5 226 776 473      branches                                                                (71,45%)
        88 846 870      branch-misses                    #    1,70% of all branches             (71,45%)
       633 061 473      l3_lookup_state.all_coherent_accesses_to_l3
       453 023 266      l3_lookup_state.l3_hit
       180 037 138      l3_lookup_state.l3_miss
       366 872 591      dTLB-loads                                                              (71,43%)
       175 787 658      dTLB-load-misses                 #   47,92% of all dTLB cache accesses  (71,41%)

       3,418202936 seconds time elapsed
We actually reduced the cache misses even more than the sorting variant, paying only a few more instructions for slightly more complex logic for status.
Praying to the microarchitectural gods, we send it in to Kattis yet again hoping for something faster and… 3.87s! We climb to second place, 0.11s behind the leader.
Cutting instructions
So we’re mostly memory latency bound when testing locally, but on Kattis the sort trick apparently doesn’t work. Let’s ignore memory optimizations and focus on cutting instructions, in the hope that we become even more memory latency bound, to the point where we can find further improvement with the kattis sort trick.
This time we’ll return to perf, but is it differently. Thanks to perf record ./bytedist < tests/4.in, we can profile the program down to instruction level. perf record saves the profile to a file, which we can then view with perf report.
Opening it, we immediately see where we’re spending most of our time right now:
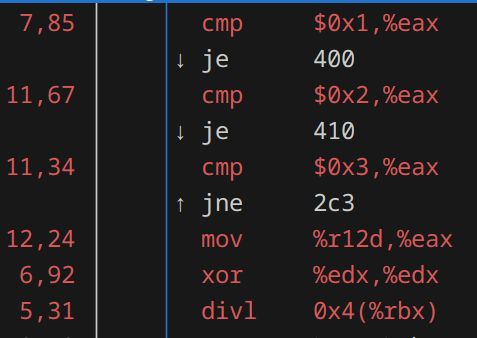
The six instructions in red are where we spend about 50% of our time. Not surprising, considering they are in our hot loop.
We’ll make only a few, precision changes: remove the SUB operation, and instead add a negation to the ADD operation, as well as reorganizing the order in which we check the operations to prioritize the most common operations. The idea is that we perform the worse in test cases with MUL and DIV, so we want those operations to have as low cost as possible.
    operations.push_back({ADD, -value, cost});
    ...
          if (op.type == DIV) {
            next_vertex /= op.value;
          } else if (op.type == MUL) {
            next_vertex *= op.value;
          } else if (op.type == ADD) {
            next_vertex += op.value;
          }
Testing this on Kattis places us on… 3.72s! With a small small margin we’re on first place with by 0.04s.
Don’t divide, multiply
Peeking at a new perf report now show a significant cost in a div instruction. Checking this table, we see that a division has a latency of ~10 cycles, while a multiplication is ~3 cycles.
For compile-time constants, compilers can instead transform your division into essentially a multiplication and shift (see this thread for the details). While we don’t have compile-time constants right now, we know that the exact set of possible numerators. Let’s tell the compiler about those, by using a switch statement:
if (op.type == DIV) {
    switch (op.value) {
    case 2:
        next_vertex /= 2;
        break;
    case 3:
        next_vertex /= 3;
        break;
    case 4:
        next_vertex /= 4;
        break;
    case 5:
        next_vertex /= 5;
        break;
    case 6:
        next_vertex /= 6;
        break;
    case 7:
        next_vertex /= 7;
        break;
    case 8:
        next_vertex /= 8;
        break;
    case 9:
        next_vertex /= 9;
        break;
    default:
        break;
    }
}
This is very nice code, but it helps a tiny bit. On Kattis, this wins 3% of time, placing us on 3.60s.
The lesson here is not to put switch statements everywhere, but to know that the compiler can do some smart things for us.
Postscript
We’ll stop here, even though there are plenty more things we could try (and some that I did, but didn’t work on Kattis - profiling blindly is not a good idea); hopefully I’ll get the chance to look at them in the future post.
If you have feedback, ideas or find any mistakes, please let me know!